ELECTRICAL RESISTIVITY IMAGING
SCAN FIRST. DRILL SMART.
Detect anomalies, locate contaminants, and know where to drill in less time with our noninvasive, ultra-high data density subsurface imaging
Targeted Drilling
"Drillable" images are produced from tens of thousands of data points
Higher Data Quality
More robust and accurate subsurface image than standard ERI
Geology Independent
Works in clay, silt, sand, gravels, bedrock, and more
Most Sites Are Hydrogeologically Complex and Accurate CSM Cannot Be Developed Without a Large Number of Field Data Points.
Not to mention, the process of detecting and remediating contaminants at environmental sites adds complicating factors.
Traditional soil and groundwater sampling techniques, like ground-penetrating radar and conventional electrical resistivity imaging (ERI), might not be the best options. You need a proven non-intrusive screening approach that works in challenging and complex hydrogeologic environments, and sometimes with added contaminant and bioactivity signatures. You need our robust data integration and experienced interpretation, combined with targeted confirmation drilling.
So how will you know where to drill?
Scan first and drill smart with Aestus GeoTrax Survey.
With Aestus GeoTrax Survey subsurface imaging, you can detect anomalies, locate contaminants, and know where to drill. You will gain a better understanding of subsurface challenges and risks, reduce uncertainties, and make better decisions.
Applications
Sinkhole Potential (geohazards)
Map Contaminant Distribution
Saline Intrusion
Detection
Geologic Mapping
Lithologic Controls
Target Water
Supply Wells
Managed Aquifer
Recharge Monitoring
Bioactivity
Assessment
Applications
Sinkhole Potential (geohazards)
Map Contaminant Distribution
Saline Intrusion Detection
Geologic Mapping
Lithologic Controls
Target Water Supply Wells
Managed Aquifer Recharge Monitoring
Bioactivity Assessment
Drill smarter, not harder.
With our fast, non-intrusive screening approach to site inspection.
- No chemical samples collected
- Higher data density
- Nonintrusive (no drilling, no digging)
- Yields focused confirmation drilling targets
- Improves subsurface certainty and project outcomes
Why Are You Still Relying on Insufficient Site Data?
Our ultra-high resolution site data helps you see subsurface issues before you drill.
The GeoTrax CSM+ Process:
Visualize. Scan. Integrate. Confirm.
Through our proprietary process that combines your existing data with our ultra-high resolution data, we locate zones of interest and increase certainty of subsurface issues for better project outcomes at lower cost and in less time.
Legend
ERI
Data Integration
CSM
3-4 Weeks Prior to Fieldwork
Visualize Existing Data
You send us your existing site data, and we visualize it in 3D to plan the most effective way to scan your site.
1-2 Weeks of Fieldwork
Conduct Fieldwork
We conduct an ultra-high resolution electrical scan with GeoTrax Survey.
8 Weeks After Fieldwork
Deliver Interim CSM Report
We integrate the two data sets in 2D and 3D, deliver an interim report with hypothesis. We then collaborate with you to select confirmation drilling locations.
Determined by You
Conduct Confirmation Drilling
You conduct targeted drilling and sampling, testing the CSM hypothesis, and send final confirmation drilling data back to us.
8 Weeks After We Receive Your Confirmation Data
Deliver Final CSM+ Report
Our final CSM+ report integrates all confirmation data and delivers it to you in 3D ultra-high resolution, so you can make better decisions and move your project forward.
*Schedules are approximate and are for reference only. We will provide project-specific schedules during the proposal phase.
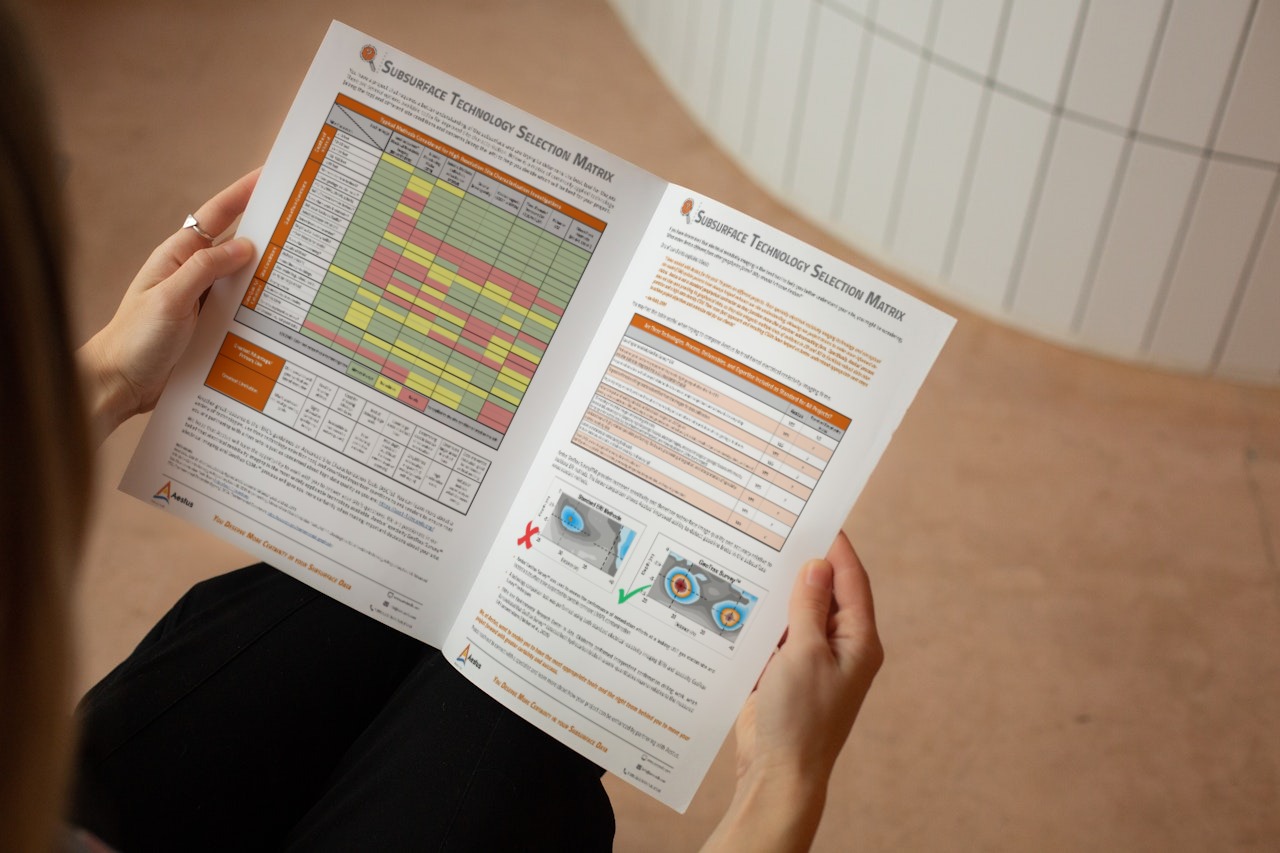
Free subsurface technology selection Matrix
Many professionals ask Aestus for advice regarding which site characterization technology is appropriate for their site challenges and goals. Our goal is to equip you with the best tools and expertise to ensure your project moves forward smoothly and successfully.
We’re excited to offer our free Subsurface Technology Selection Matrix, designed to give you the technical insights needed to make informed decisions about which of the varied site characterization technologies is the best fit for your site.

By providing your contact information, Aestus will add you to our mailing list and send you periodic news and updates.