DATA INTEGRATION AND 3D VISUALIZATION
See and understand your site data
We'll take your existing data and integrate it with our subsurface imagery and other multiple lines of evidence in one place, allowing all project stakeholders to visualize the data in 3D and make decisions collaboratively and with more certainty.
Visualize Historical Data
Integrate pre-existing site data into 3D visualization software
Integrate w/ Imaging Data
View and interpret multiple lines of evidence related to subsurface issues
Realize ROI
Capitalize on your investment in historical drilling data. Make informed decisions and focus the next steps on your project for better success
Your project can't move forward until all decision makers can see, and make sense of, the site data.
You’ve invested in drilling at your site, but the resulting data are not giving you a complete picture to guide you and your stakeholders to the next step in the process.
When you combine your historical site data with our electrical image data collected in the field with confirmation drilling data, a more complete and accurate conceptual site model (CSM+) emerges. When you share that picture with your team and stakeholders, you can make the decisions needed to move your project forward.
Don't just see but understand your data with Aestus GeoTrax Viz.
The Aestus GeoTrax Viz process effectively integrates multiple lines of evidence into one place, allowing all project stakeholders to visualize the data in 3D, use it to make better business and technical decisions, and move your project forward.
Applications
Monitoring Injection Sites
Determining Contaminant Distribution
Evaluating Sinkhole Potential (geohazards)
Locating Tunnels Related To Homeland Security Concerns
Detecting Saline Intrusion Into Drinking Water Wells
Checking for Piping in Earthen Dams
Integrate multiple lines of evidence in one place for total visibility
Including:
- Existing (historical) data
- Historical aerial photographs
- Site use maps
- Regional groundwater gradient data
- Aestus Geotrax Survey imaging data
- Follow-up confirmation drilling and sampling data
When all your stakeholders can see the data in the same way, you can more quickly agree on the best path forward on the project, typically saving both time and money.
The GeoTrax CSM+ Process:
Visualize. Scan. Integrate. Confirm.
Through our proprietary process that combines your existing data with our ultra-high resolution data, we locate zones of interest and increase certainty of subsurface issues for better project outcomes at lower cost and in less time.
Legend
ERI
Data Integration
CSM
3-4 Weeks Prior to Fieldwork
Visualize Existing Data
You send us your existing site data, and we visualize it in 3D to plan the most effective way to scan your site.
1-2 Weeks of Fieldwork
Conduct Fieldwork
We conduct an ultra-high resolution electrical scan with GeoTrax Survey.
8 Weeks After Fieldwork
Deliver Interim CSM Report
We integrate the two data sets in 2D and 3D, deliver an interim report with hypothesis. We then collaborate with you to select confirmation drilling locations.
Determined by You
Conduct Confirmation Drilling
You conduct targeted drilling and sampling, testing the CSM hypothesis, and send final confirmation drilling data back to us.
8 Weeks After We Receive Your Confirmation Data
Deliver Final CSM+ Report
Our final CSM+ report integrates all confirmation data and delivers it to you in 3D ultra-high resolution, so you can make better decisions and move your project forward.
*Schedules are approximate and are for reference only. We will provide project-specific schedules during the proposal phase.
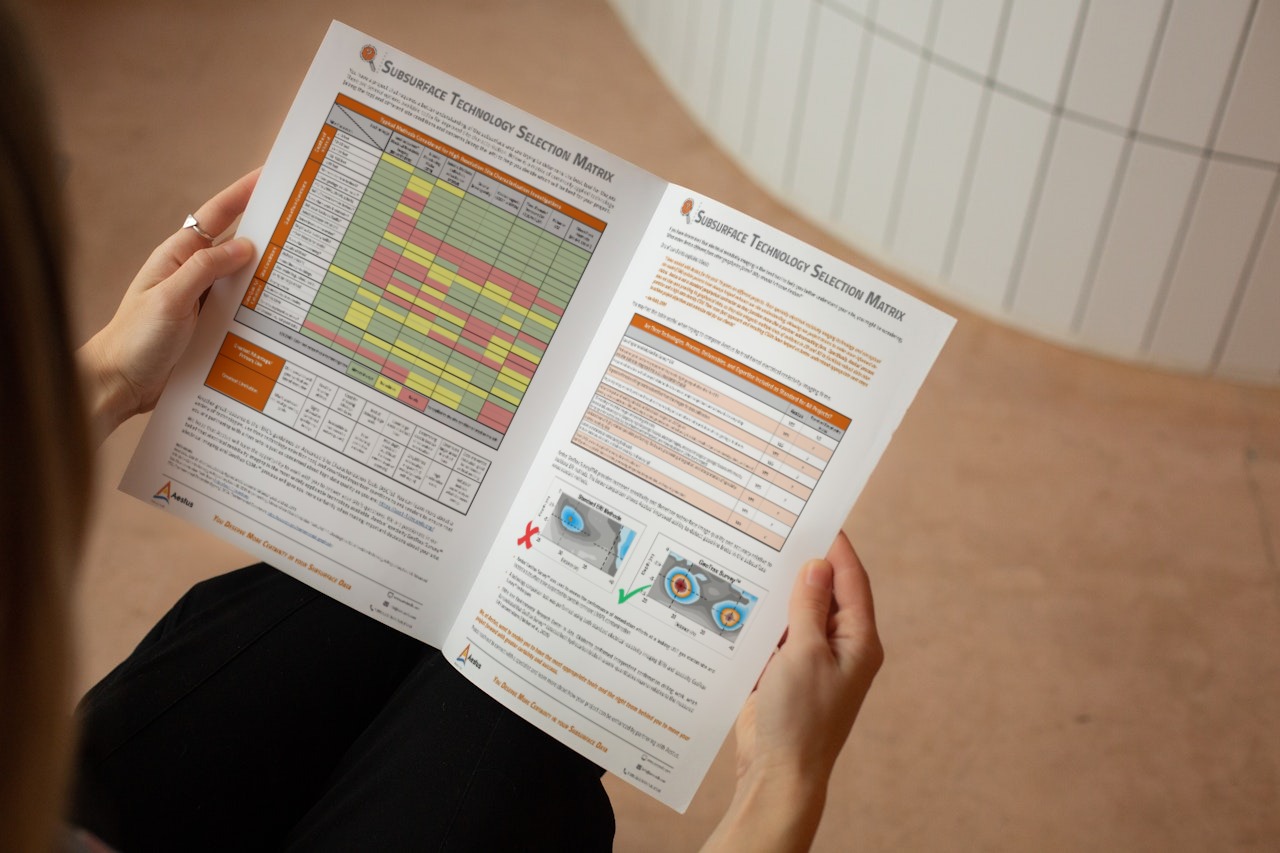
Free subsurface technology selection Matrix
Many professionals ask Aestus for advice regarding which site characterization technology is appropriate for their site challenges and goals. Our goal is to equip you with the best tools and expertise to ensure your project moves forward smoothly and successfully.
We’re excited to offer our free Subsurface Technology Selection Matrix, designed to give you the technical insights needed to make informed decisions about which of the varied site characterization technologies is the best fit for your site.

By providing your contact information, Aestus will add you to our mailing list and send you periodic news and updates.